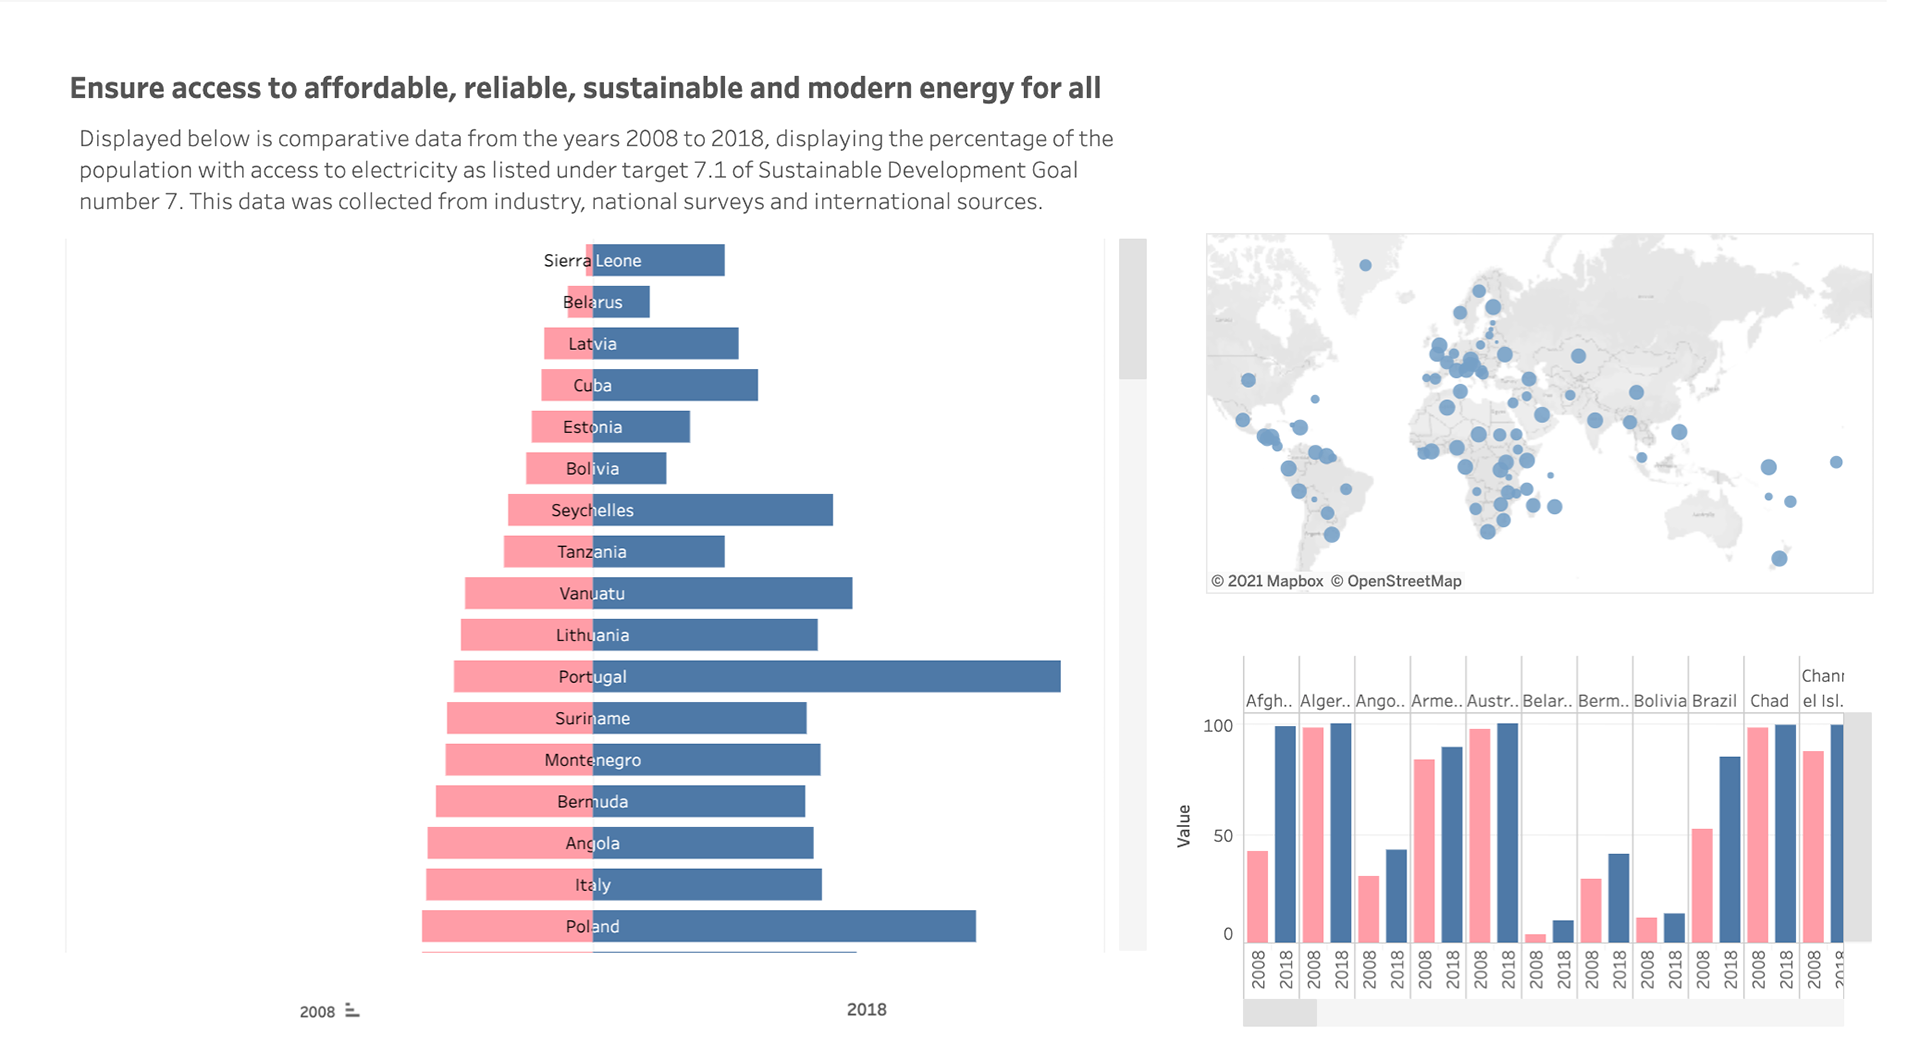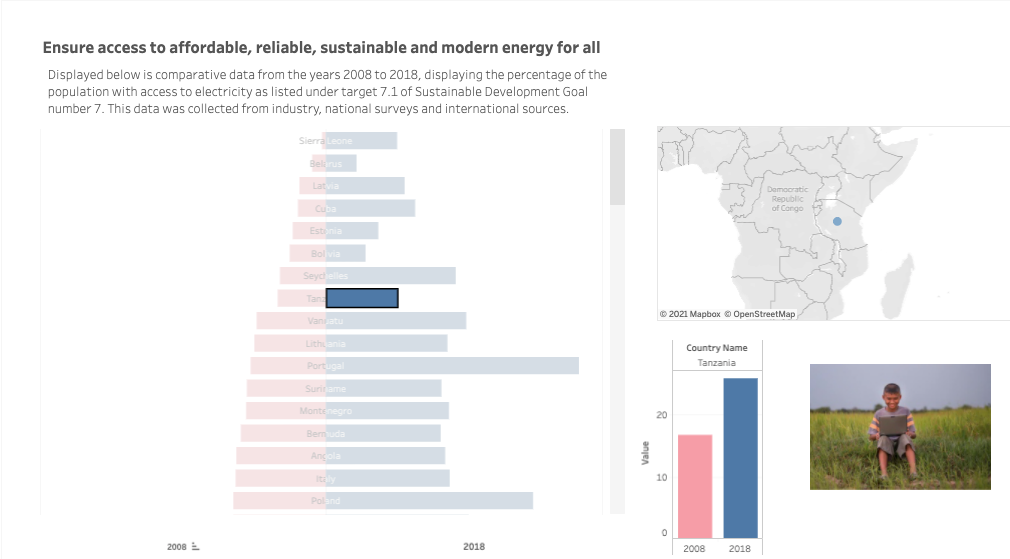

This was a brief that required learning the software 'Tableau' and creating a data visualisation based on one of the UN's sustainable development goals. Finding a dataset based on the UN's goals, I downloaded the goal 'Ensure access to affordable, reliable, sustainable and modern energy for all' and downloaded a relevant dataset containing data on 'Global access to Electricity' which I could use to show improvement over time. I then cleaned the data by removing the parts that were incorrect or completely blank fields/rows. Then using the program Tableau, I imported my cleaned data and visualised the improvement to my development goal over the time time period 2008 to 2018 showing the visualisation by way of a diverging 'Butterfly Chart' (Link below)...
https://public.tableau.com/profile/j6441#!/vizhome/Accesstoelectricity2008to2018Finishedfullworking/Dashboard1