

Tasked with creating an infographic using my own data collected over 3 days, I recorded the amount of drinks I consumed along with how cold they had become, which personally relates back to how much I procrastinated from doing work at home (everyday work such as washing, cleaning, cooking and car maintenance).
The cafe menu is the key for the data and everything on the table has some form of meaning. This was printed onto vinyl and stuck to a coffee table in the University coffee shop to be a lesson to students about procrastination.
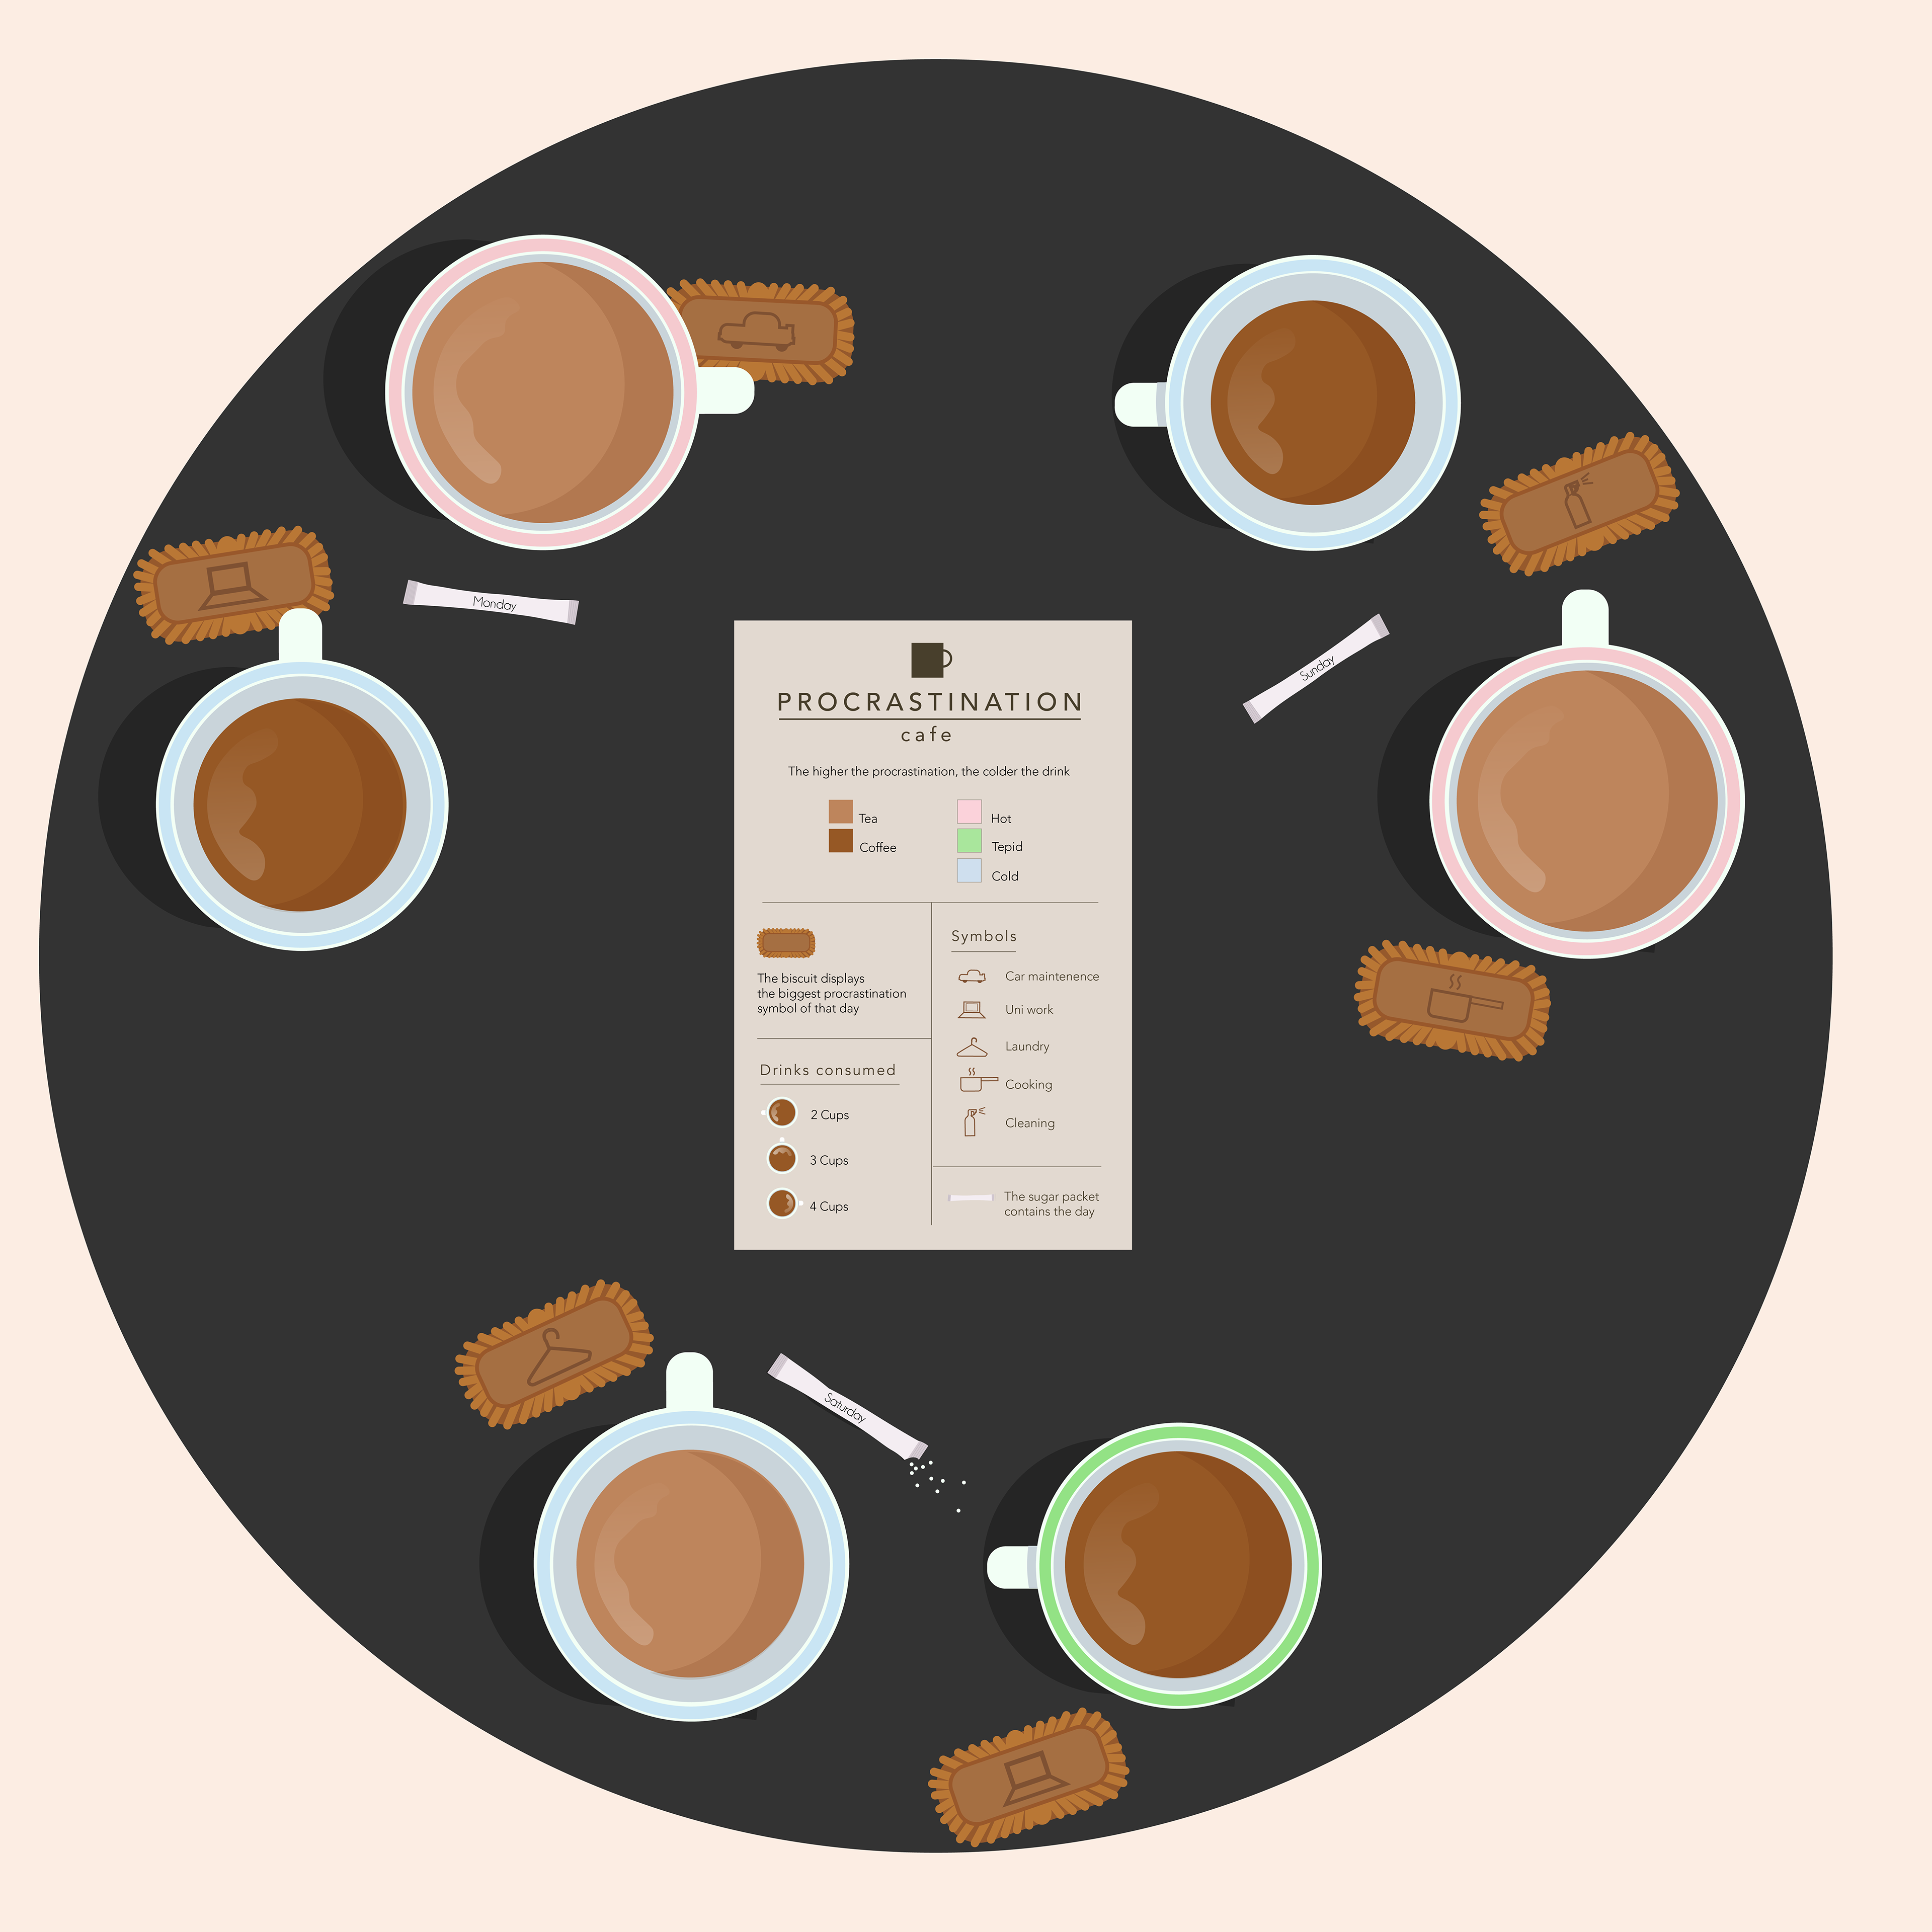
The finished infographic image
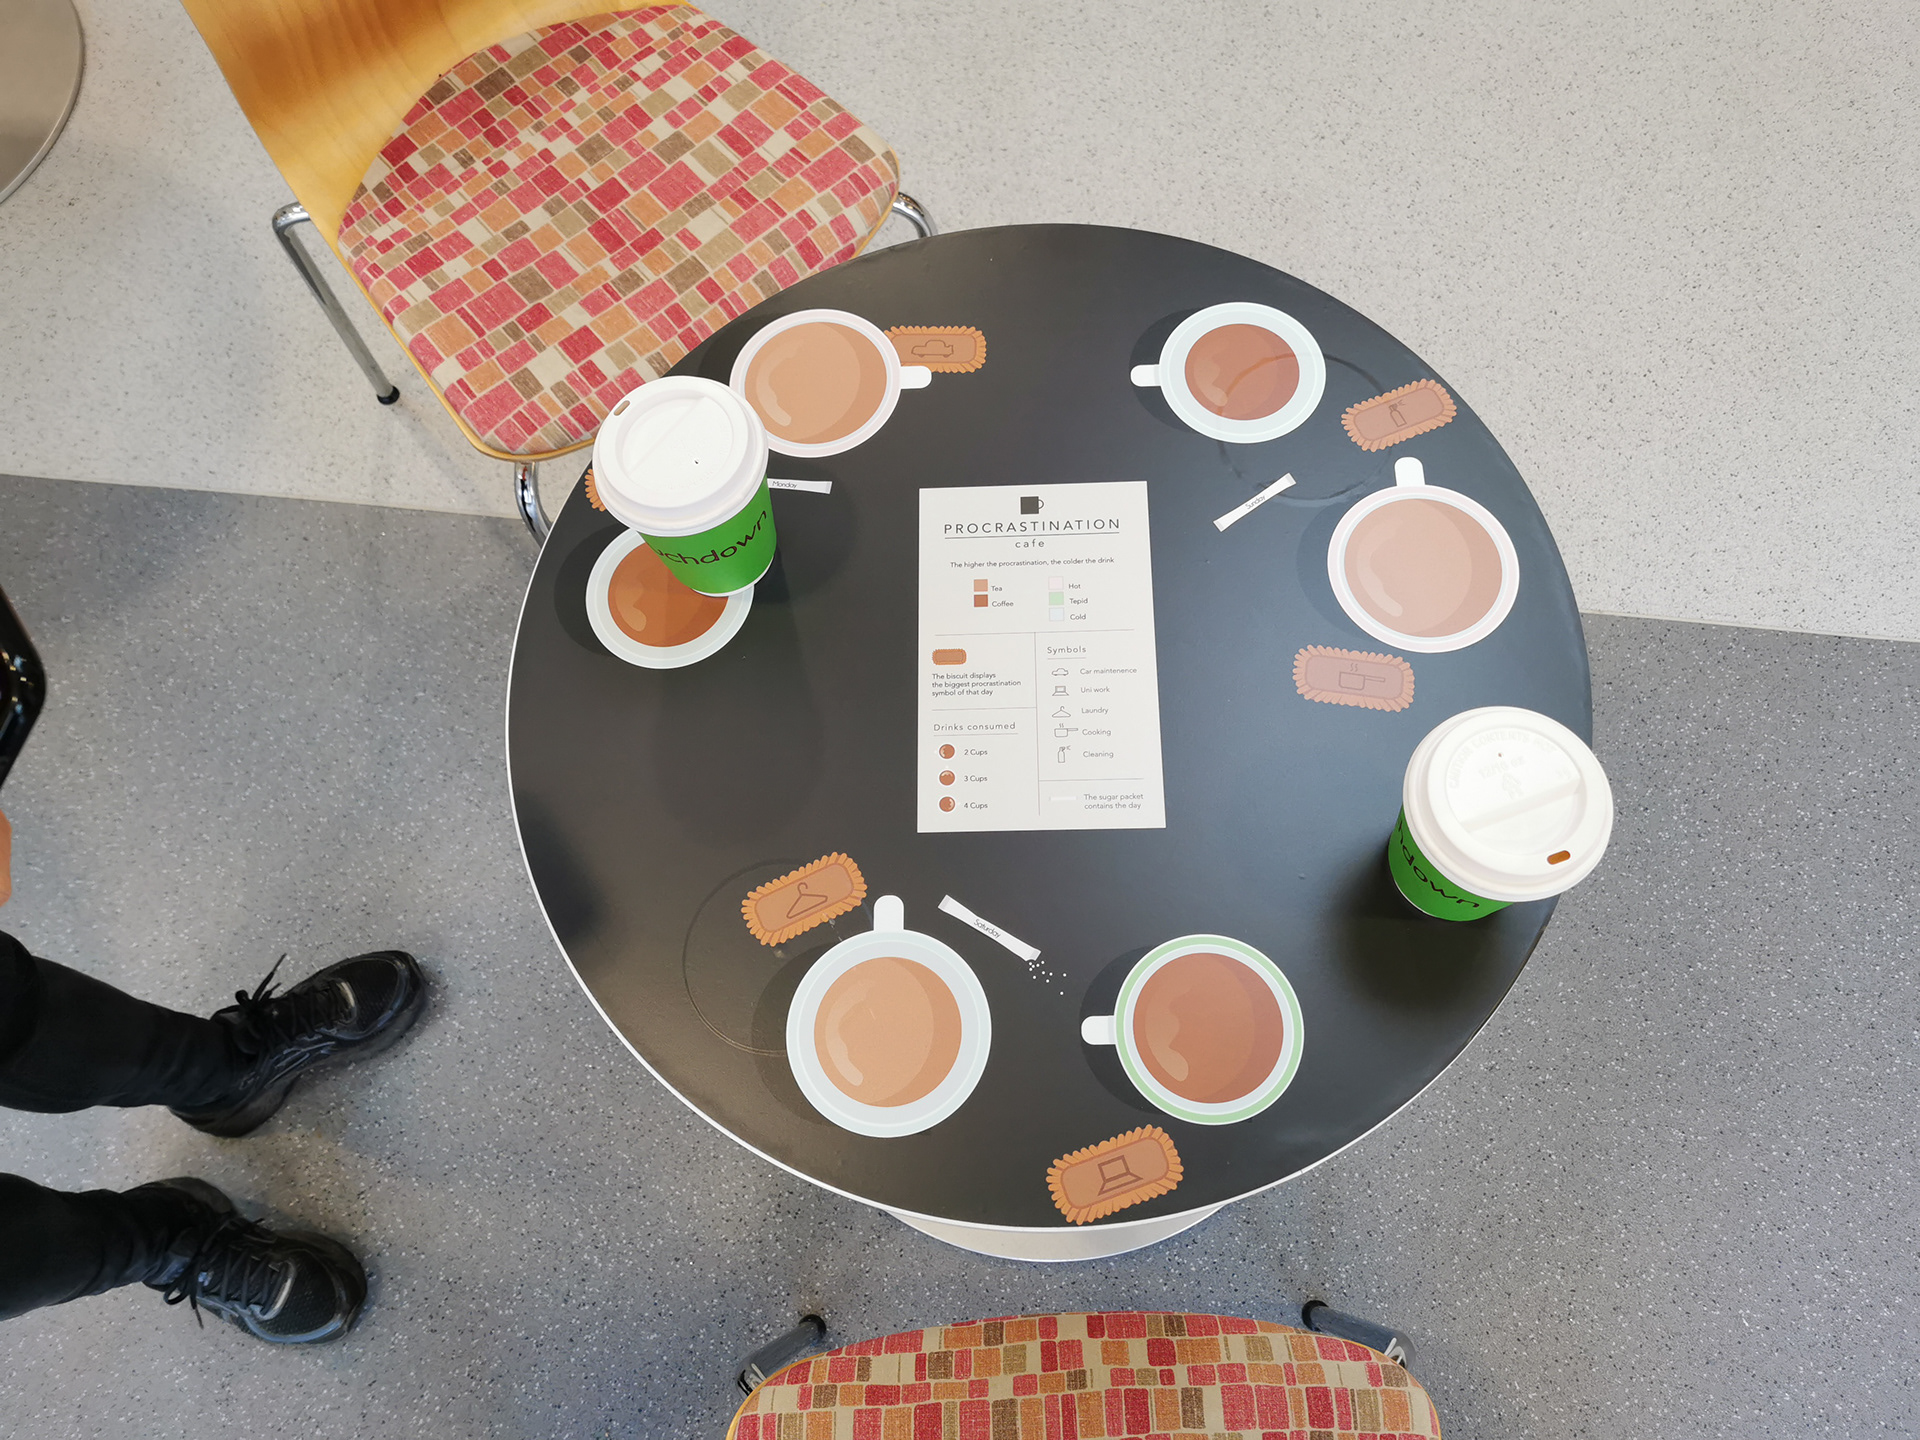
Printed vinyl infographic, placed and stuck to the University table